In Brief: We will delve into the world of Google Analytics to understand the meaning and significance of bounce rate, session, and the “not set” label. We’ll discuss the impact these metrics have on your website’s performance and user experience, while offering practical tips and suggestions for optimization. By examining real-life examples, case studies, and relevant statistics, we aim to provide you with a comprehensive understanding of these key concepts and empower you to make data-driven decisions for your website’s growth and success.


Introduction
Google Analytics (GA) offers a wealth of information that can help you optimize your website’s performance and user experience. However, it can be overwhelming to understand and interpret the various metrics and terms.
In this article, we will explain three important concepts:
- Sessions
- Bounce Rate
- Not Set
But, beforehand, it is important to be able to understand how users engage with your website as it is vital for optimizing its performance and enhancing user experience.
An essential aspect of the analysis is tracking sessions in Google Analytics. I’ll try to cover how these sessions are measured and how they can help you make data-driven decisions to improve your website’s overall performance.
In GA, an individual is a user that is visiting your website, and this is when a session starts.

What are Google Analytics Sessions?
A GA session is a time frame during which a user interacts with your website. When a user lands on your site, they initiate a session, and GA records their activities (referred to as “hits”) during this period of time.
These activities can include page views, button clicks, events, and transactions. Sessions act as contained that hold all the user interactions and activities on your site.
Analyzing these sessions can help you gain insights into user behavior, how much time they spend on your site, and what actions they take during their visits. These sessions end under one of the following conditions:
- The user is inactive for 30 minutes
- They arrive at your site via another campaign source
- Midnight
Let’s make it clear that sessions are different from clicks in advertising platforms like Google Ads or Facebook Ads. First, the number of sessions from a campaign will almost always be lower than the reported number of clicks, as a session may not be recorded if a user closes their browser before the GA script loads.
Users, Sessions, and Page Views
Users: In Google Analytics, a user is an individual that visits your website. The users metric records the number of individuals visiting your site, while the sessions metric captures how many times those individuals visited. A single user can register multiple sessions, but a session cannot have multiple users. As a result, you will usually see more sessions than users in GA.
Page View: A page view, on the other hand, is a single instance of a user loading or reloading a page on your website. Typically, a user initiates a session with a page view and might trigger multiple page views during their session. GA will often show more page views than sessions and more sessions than users.
How a Session is Measured
Google Analytics users cookies to distinguish individual users and track their sessions. When someone visits your site, GA will start a session, set a cookie on the user’s device, and assigns it a session ID. When a user interacts with your website, GA records various hits (e.g., page, views, clicks, transactions) as a part of session data. When the session ends, it records the final session data.
A session ends by default due to user inactivity for 30 minutes; if the he comes back after 30 minutes of inactivity, a new session begins. If they return within 30 minutes are up the original session resume. Whereas in GA 4, there is no limit to how long a session can last.
Note: Google will be sunsetting Universal Analytics in favor of GA4; therefore, migrating your UA property settings before the 1st of July 2023 is essential, so you don’t lose data.
You can customize the session timeout duration in both Universal Analytics and Google Analytics 4. Before changing the timeout settings, consider factors such as:
- Website’s Content
- User Engagement
- Logout Settings
Modifying the session timeout settings will only affect future data.
The number of sessions reported in Universal Analytics and GA4 may differ due to their respective session-ending mechanisms. While both platforms end a session after 30 minutes of inactivity by default, Universal Analytics also automatically ends a session at midnight and starts a new one. On the contrary, GA4 does not start a new session at midnight.
Finding Sessions in Google Analytics and Using it with Other Tools
To access session data for your website, one has to navigate to the appropriate section within the dashboard of either Universal Analytics or Google Analytics 4. You can adjust the time frame and compare session data over specific periods or year over year to gain valuable insights into user behavior and engagement.
You can integrate tools to GA, such as Semrush’s Organic Traffic Insights, which can provide valuable information on your domain’s top landing pages, user metrics, and even “not provided” keywords that GA doesn’t report. Combining data from these powerful sources allows you to access accurate information that can help improve your organic search ranking and user experience.
Google Analytics has a metric called “engaged sessions”; these sessions are those that last 10 seconds or longer, including one or more conversion events or featuring two or more page views. This metric is automatically populated, and you can adjust the ten-second threshold up to a minute to gain more insights into user engagement.
Common Misconceptions about Sessions
Some people assume that sessions and unique visitors are the same. However, a single user can have multiple sessions, so it’s important to understand the difference between these metrics.
Tip: To gain deeper insights into user behavior, use segments to analyze specific groups of visitors, such as those coming from a particular traffic source or those who view more than a certain number of pages per session.
Real-life example: A digital marketing agency segmented their clients’ website traffic by the number of pages viewed per session. They discovered that those that viewed more than five pages had a much higher conversion rate than those that viewed fewer pages. This insight led the agency to focus on improving user engagement and promoting internal linking, which ultimately increased their clients’ overall conversion rates.
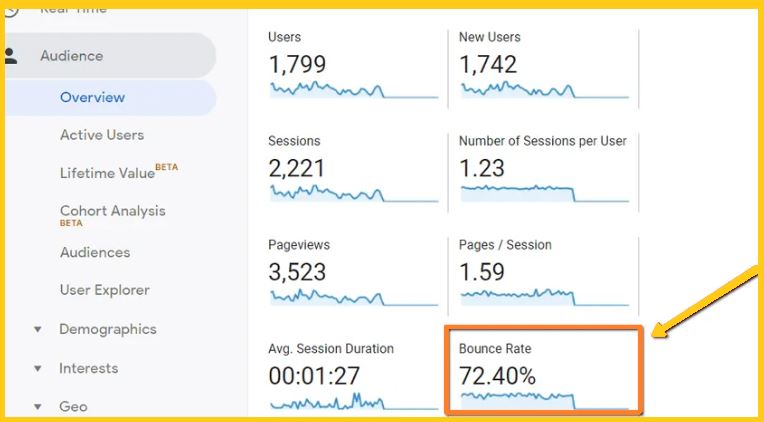
Bounce Rate
A bounce is a single-page session where a visitor lands on your website and leaves without interacting with any other pages. Bounce rate measures the percentage of single-page sessions compared to the total number of sessions on your website. It’s an indicator of how well a specific page performs in relation to your entire site.
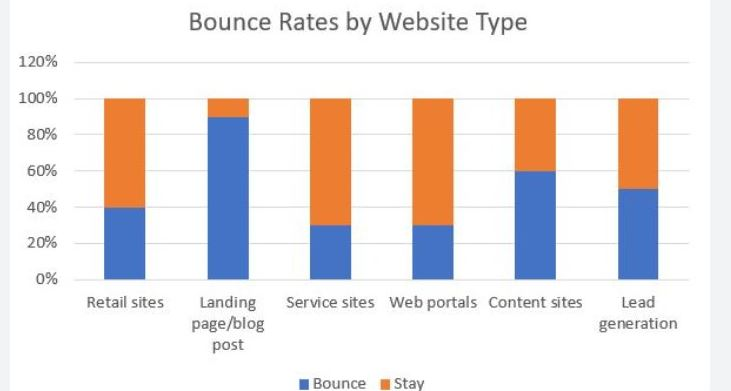
High bounce rates can indicate low-quality content or a poor user experience. However, the context matters; a high bounce rate on a blog post may not be as concerning as on a product page or homepage. It’s essential to consider the search intent and the purpose of the page when interpreting bounce rates.

Common Misconceptions about Bounce Rates
Many people believe that a high bounce rate is always bad, but this is not necessarily true. For instance, if a user lands on a blog post, finds the information they need, and leaves satisfied, this is considered a successful visit despite a high bounce rate.
Tip: To reduce bounce rate, consider improving website navigation, optimizing page load times, and creating engaging content that encourages users to explore your website further.
Real-life example: An online store selling handmade soap found that its high bounce rate was due to slow page load times. After optimizing images and implementing a caching plugin, the site’s load time improved significantly, resulting in a 27% in bounce rate and an increase in overall conversions.
‘Not Set’ in Google Analytics
In GA, ‘not set’ is a placeholder value that appears when data for a particular dimension is unavailable. This can occur for various reasons, such as a lack of information, misconfiguration, or technical issues with data collection.
Here are some instances when this can appear:
- Channel grouping: If Google Analytics cannot determine the source or medium of a session, it will be marked as ‘not set‘.
- Keywords: Organic search keywords may appear as ‘not set’ due to privacy restrictions in search engines like Google, which limit the visibility of search query data.
- Page title: If a page on your website lacks a title tag or has a technical issue preventing GA from capturing the title, it will be marked as ‘not set’.
Common Misconceptions about ‘not set’
Some users might believe that ‘not set’ is an error or a problem with their Google Analytics setup. However, it simply means that the information is not available for a particular metric or dimension.
Tip: If you see ‘not set’ as a value for the traffic source, ensure that all of your marketing campaigns are properly tagged with UTM parameters, so GA can correctly attribute the traffic to the appropriate source.
Real-life example: A content marketing company noticed a considerable amount of ‘not set’ data in their Google Analytics traffic source reports. After auditing their UTM parameters and ensuring that all marketing campaigns were correctly tagged, the ‘not set’ data was dramatically reduced, providing the company with more accurate insights into the effectiveness of their campaigns.
Additional Metrics
To further enhance your understanding of Google Analytics, there are several other metrics and dimensions to be familiar with:
- Page per session
The average number of page views that occur during a single session.
- Conversion rate
The percentage of sessions that result in a completed goal or transaction on your website.
- Direct traffic
Sessions begin with users directly typing your website’s URL into their browser.
- Organic traffic
Sessions originating from unpaid search engine results.
- Referral traffic
Sessions originate from links on other websites, excluding other traffic types such as social, paid, or organic. Referring sites are external websites that send traffic to your site, usually due to backlinks.
- Social traffic
Sessions originate from social media platforms like Twitter, Facebook, Instagram, or Linkedin.
- Site speed
A metric that measures how quickly your website loads on average. The faster-loading site can improve user experience and positively impact SEO.
- Time on page
This metric can provide insights into user engagement and content effectiveness.
- Segments
A feature that allows you to divide your website traffic into smaller groups based on shared characteristics, such as mobile users from specific sources or who view a certain number of pages.
- User Flow
A visualization of the pages a user visits on your site during a single session, from the landing page to the exit page.
- View
A component of your GAs property that contains data from your website. Views can include a complete set of data from your tracking code or a subset of data using filters.
- Visitor Flow
A report that shows how users interact with your site in chronological order, from the landing page to the exit page.


Some statistics that you might find useful:
According to a study by databox on average, 35.90% of their respondents see a bounce rate between 26-40%; as for exit rates, 28.21% have an exit rate of between 26-40% and below 25% each.
According to Neil Patel an average bounce rate in different industries is around 47%.
A study by ContentSquare found that they saw that an average user spends 4 minutes and 24 seconds per visit across all industries.
A survey conducted by several companies concluded that more than 56% of companies are not personalizing the web experience of visitors, while only 4% claim that customer experiences are personalized.
In Conclusion
Remember that Google Analytics is just one layer of website analysis, and it’s essential to consider other factors like user demographics and intent to develop a comprehensive understanding of your website’s performance. Continue to explore the various metrics and dimensions available in Google Analytics, and utilize resources like this article to guide you through the learning process. With time and practice, you’ll become proficient in interpreting your site’s data and using it to drive meaningful improvements.
Relevant Articles:
Beginner’s Guide to Vertex AI: Google Cloud’s ML Platform
AlphaGo to Quantum Computing: Google Bard or Microsoft Bing?
How to Use Google Keyword Planner for Keywords to your Blog